
Data Transformation Workspace
Data Transformation Workspace
Data Transformation Workspace
From Complex Node Graphs to Intuitive Table-Centric Interface
Toric was initially conceived to centralize data from various sources in the construction industry, empowering users to generate insights without requiring coding skills. The platform’s no-code node graph interface enabled users to build complex data pipelines by connecting modular nodes, offering both flexibility and power.
As the design lead, I took charge of redesigning our data transformation platform to enhance usability and ensure that the product aligned more closely with user needs and expectations.

See the website
Product
Web app SAAS
What I did
Product Design
Stakeholder management
Interactive prototyping
User research & testing
My role
Design Lead
Timeline
Design Lead
The problem
The problem
As we gathered feedback and observed market trends, we recognized an opportunity to evolve our offering. While our initial focus on the construction industry provided valuable insights, it also revealed that a broader application could better leverage our platform’s strengths. This feedback led to a strategic pivot, shifting our focus from the construction industry to a more expansive, AI-driven platform now known as Datagrid.
In this new direction, users bring in their data to interact with AI agents via chat, unlocking powerful insights and making data interaction more intuitive. This pivot, along with the rebranding effort, required a redesign of the platform from a node graph interface to a more user-friendly, table-centric design. As the lead designer, I spearheaded this transformation to enhance usability, align with our new vision, and create a product that resonates more strongly with our users and the market.


Research
Research
Through conversations with our customers, we found that while they were excited about Toric’s powerful data transformation capabilities, the node graph interface presented challenges. Users enjoyed working with the interface, but it created a document structure that wasn’t scalable—only the original creator could navigate it effectively. This complexity made collaboration difficult and was intimidating for new users, who had to manually connect operations through a series of wires.
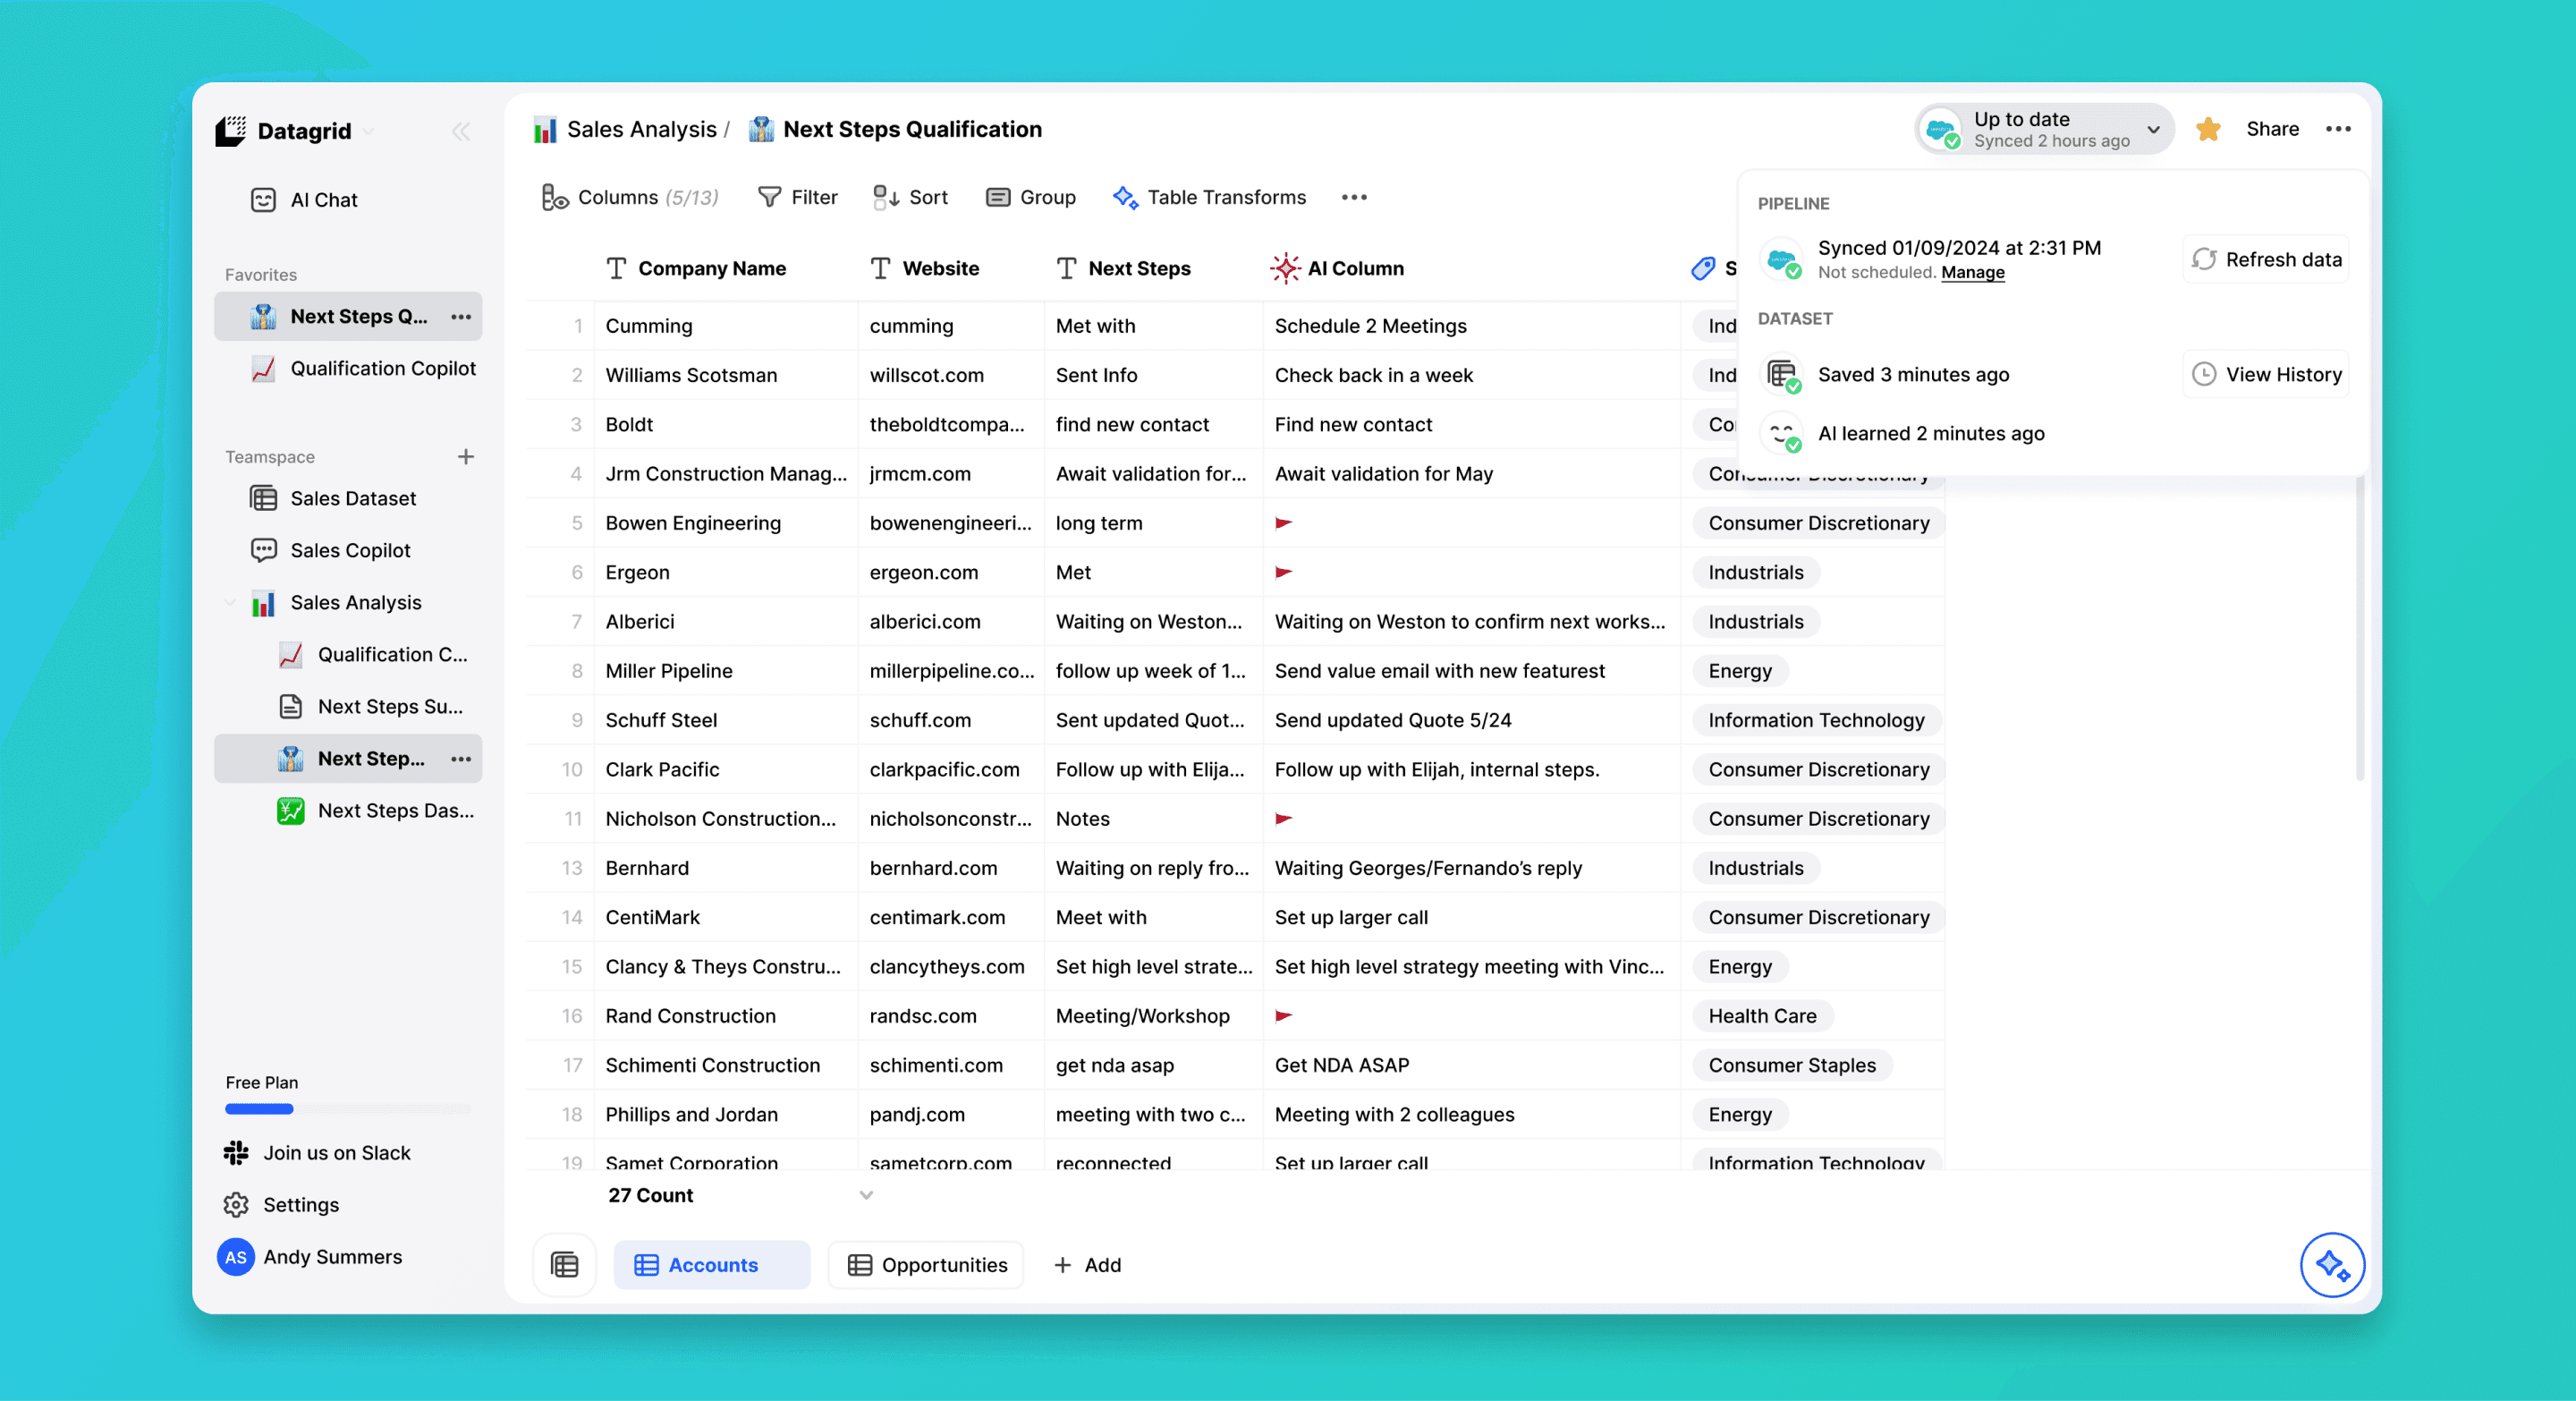
To address these issues, we introduced the table workspace, which immediately resonated with our customers. The table format offered a more familiar and structured environment, making data transformations more accessible and intuitive. The positive feedback we received highlighted how the table workspace simplified workflows, reduced the learning curve, and made Toric’s capabilities more user-friendly and scalable.
The Solution
The Solution
The transformation workspace is designed to streamline data management and manipulation through a table-centric interface. Users can import data from multiple sources, organize it into tables within datasets, and apply powerful transformations.
• Data Import: Supports importing data from files (CSV, Excel) or over 100 data connectors (Salesforce, HubSpot, Notion, etc.).
• Data Augmentation and Transformation: Includes generated columns (using LLMs, formulas, AI agents) and transformation tools (filtering, find and replace).
• Table View Operations: Tools for sorting, filtering, grouping, and formatting that affect the data view without altering the data itself.
• Automated Data Processing: Automates the transformation process, with the data stored in our data warehouses.
• AI Integration: Allows transformed data to be used with custom AI agents for generating reports, assisting in daily tasks, and more.


Impact
Impact
A key goal of the redesign was to make Toric a Product-Led Growth (PLG) platform. The previous node graph interface required a white-glove onboarding process, making it difficult for users to independently explore and find value, which hindered our ability to scale.
With the new table-centric workspace, users are now able to enter the platform, explore its features, and achieve meaningful outcomes on their own. This shift has enabled customers to get to value more quickly without needing extensive guidance, aligning perfectly with our PLG strategy.
Next Steps
Next Steps
The pivot from a node graph to a table-centric design underscored the importance of user feedback in shaping product strategy. The success of the redesign highlighted the value of simplifying complex processes to enhance usability.
Next Steps:
We plan to continue refining the workspace, exploring additional AI integrations, and expanding the feedback loop to ensure ongoing improvements align with user needs.

Interested in discussing how I can contribute to your team?
Let’s connect!
pierreolivierblais@gmail.com
©2024 Pierre-Olivier Blais

Interested in discussing how I can contribute to your team?
Let’s connect!
pierreolivierblais@gmail.com
©2024 Pierre-Olivier Blais

Interested in discussing how I can contribute to your team?
Let’s connect!
pierreolivierblais@gmail.com
©2024 Pierre-Olivier Blais

Interested in discussing how I can contribute to your team?
Let’s connect!
pierreolivierblais@gmail.com
©2024 Pierre-Olivier Blais
